Grid Manipulations (merge, split, refine, transform)
Notes
Most grid transformations such as merge and transpose return a
new object, allowing consecutive operations to be chained together.
Optionally, you can pass inplace=True to the call signature to
modify the existing object and return None. Both approaches are
demonstrated below.
In [1]:
%matplotlib inline
import numpy as np
import matplotlib.pyplot as plt
import pandas
from shapely.geometry import Point, Polygon
import geopandas

import pygridgen as pgg
import pygridtools as pgt
Basic merging operations
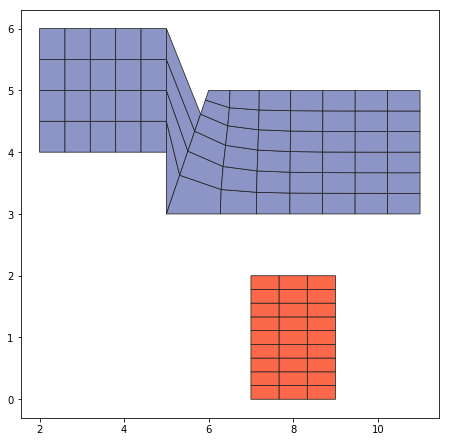
The function below create our 3 test model grids moving counter-clockwise in the figure shown two cells down.
In [2]:
def to_gdf(df):

    return (
        df.assign(geometry=df.apply(lambda r: Point(r.x, r.y), axis=1))
          .drop(columns=['x', 'y'])
          .pipe(geopandas.GeoDataFrame)
    )


def make_test_grids():
    domain1 = pandas.DataFrame({'x': [2, 5, 5, 2], 'y': [6, 6, 4, 4], 'beta': [1, 1, 1, 1]})
    domain2 = pandas.DataFrame({'x': [6, 11, 11, 5], 'y': [5, 5, 3, 3], 'beta': [1, 1, 1, 1]})
    domain3 = pandas.DataFrame({'x': [7, 9, 9, 7], 'y': [2, 2, 0, 0], 'beta': [1, 1, 1, 1]})

    grid1 = pgt.make_grid(domain=to_gdf(domain1), nx=6, ny=5, rawgrid=False)
    grid2 = pgt.make_grid(domain=to_gdf(domain2), nx=8, ny=7, rawgrid=False)
    grid3 = pgt.make_grid(domain=to_gdf(domain3), nx=4, ny=10, rawgrid=False)

    return grid1, grid2, grid3
Display positions of grids relative to each other
In [3]:
grid1, grid2, grid3 = make_test_grids()

fig, ax = plt.subplots(figsize=(7.5, 7.5))
_ = grid1.plot_cells(ax=ax, cell_kws=dict(cmap='Blues'))
_ = grid2.plot_cells(ax=ax, cell_kws=dict(cmap='Greens'))
_ = grid3.plot_cells(ax=ax, cell_kws=dict(cmap='Reds'))

Merge grids 1 and 2 together, horizontally
By default, the bottom rows are aligned and the cell mask is not updated. We do that manually for now.
In [4]:
one_two = grid1.merge(grid2, how='horiz')
fig, ax = plt.subplots(figsize=(7.5, 7.5))
_ = one_two.plot_cells(ax=ax, cell_kws=dict(cmap='BuPu'))
_ = grid3.plot_cells(ax=ax, cell_kws=dict(cmap='Reds'))
Use the shift parameter to center grid 2
Use shift=-1 since we’re sliding grid 2’s i-j indexes downward
relative to grid 1
In [5]:
one_two = grid1.merge(grid2, how='horiz', shift=-1)

fig, ax = plt.subplots(figsize=(7.5, 7.5))
_ = one_two.plot_cells(ax=ax, cell_kws=dict(cmap='BuPu'))
_ = grid3.plot_cells(ax=ax, cell_kws=dict(cmap='Reds'))

Vertically merge grid 2 and grid 3
Notice that by default, the grids are left-aligned and the bottom of grid 3 ties into the top of grid 2
In [6]:
two_three = grid2.merge(grid3, how='vert', shift=2)
fig, ax = plt.subplots(figsize=(7.5, 7.5))
_ = grid1.plot_cells(ax=ax, cell_kws=dict(cmap='Blues'))
_ = two_three.plot_cells(ax=ax, cell_kws=dict(cmap='YlOrBr'))

Try again, switching the order of the grids
Notice the change in sign of the shift parameter.
In [7]:
two_three = grid3.merge(grid2, how='vert', shift=-2)

fig, ax = plt.subplots(figsize=(7.5, 7.5))
_ = grid1.plot_cells(ax=ax, cell_kws=dict(cmap='Blues'))
_ = two_three.plot_cells(ax=ax, cell_kws=dict(cmap='YlOrBr'))

Alternatively, you can switch the arguments and use where='-' to indicate that the “other” grid is below the first.
And the sign of the shift parameter returns to its original value.
In [8]:
two_three = grid2.merge(grid3, how='vert', where='-', shift=2)

fig, ax = plt.subplots(figsize=(7.5, 7.5))
_ = grid1.plot_cells(ax=ax, cell_kws=dict(cmap='Blues'))
_ = two_three.plot_cells(ax=ax, cell_kws=dict(cmap='YlOrBr'))

Now merge all three in a single chained operation (inplace=False).
In [9]:
grid1, grid2, grid3 = make_test_grids()
all_grids = (
    grid2.merge(grid3, how='vert', where='-', shift=2)
         .merge(grid1, how='horiz', where='-', shift=11)
)

fig, ax = plt.subplots(figsize=(7.5, 7.5))
_ = all_grids.plot_cells(ax=ax, cell_kws=dict(cmap='GnBu'))

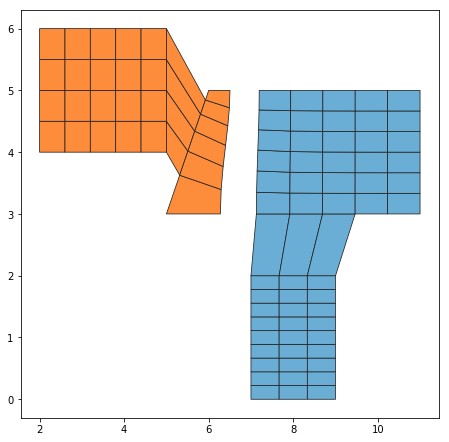
Split the final grid into two vertical parts
grid.split(<index of split>, axis=0)
In [10]:
grid_bottom, grid_top = all_grids.split(14, axis=0)

fig, ax = plt.subplots(figsize=(7.5, 7.5))
_ = grid_bottom.plot_cells(ax=ax, cell_kws=dict(cmap='OrRd'))
_ = grid_top.plot_cells(ax=ax, cell_kws=dict(cmap='BuPu'))

Splitting and linearly refining columns and rows
Split the final grid into two horizontal parts
grid.split(<index of split>, axis=1)
In [11]:
grid_left, grid_right = all_grids.split(8, axis=1)

fig, ax = plt.subplots(figsize=(7.5, 7.5))
_ = grid_left.plot_cells(ax=ax, cell_kws=dict(cmap='Oranges'))
_ = grid_right.plot_cells(ax=ax, cell_kws=dict(cmap='Blues'))
Refine individual rows of the grid cells
grid.refine(<index of cell>, axis=0, n_points=<num. of divisions>)
In [12]:
fig, ax = plt.subplots(figsize=(7.5, 7.5))
_ = (
    all_grids
        .insert(13, axis=0, n_nodes=2)
        .plot_cells(ax=ax, cell_kws=dict(cmap='Blues'))
)
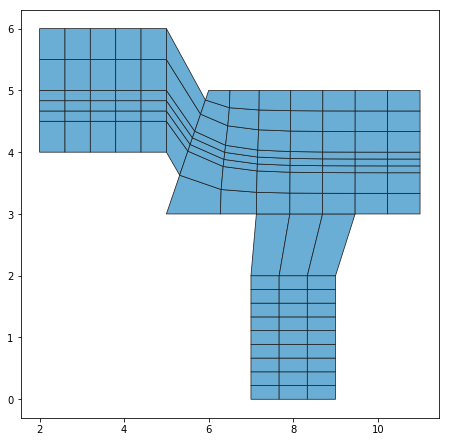
Refine individual columns of the grid cells
grid.refine(<index of cell>, axis=1, n_points=<num. of divisions>)
In [13]:
fig, ax = plt.subplots(figsize=(7.5, 7.5))
_ = (
    all_grids
        .insert(10, axis=1, n_nodes=4)
        .plot_cells(ax=ax, cell_kws=dict(cmap='Blues'))
)

Chained operations
One big chained operation for fun
In [14]:
def make_fake_bathy(grid):
    j_cells, i_cells = grid.cell_shape
    y, x = np.mgrid[:j_cells, :i_cells]
    z = (y - (j_cells // 2))** 2 - x
    return z


fig, ax = plt.subplots(figsize=(7.5, 7.5))

g = (
  grid2.merge(grid3, how='vert', where='-', shift=2)
       .merge(grid1, how='horiz', where='-', shift=11)
       .insert(10, axis=1, n_nodes=4)
       .insert(13, axis=0, n_nodes=2)
       .transform(lambda x: x*5 + 2)
)

bathy = make_fake_bathy(g)
_ = g.plot_cells(ax=ax, cell_kws=dict(cmap='Blues', colors=bathy))
