Masking grid cells
This tutorial will demonstrate the following:
- Basics of grid masking
- Reading boundary, river, and island data from shapefiles
- Generating a focused grid
- Masking land cells from the shapefiles
- Writing grid data to shapefiles
In [1]:
%matplotlib inline
import numpy as np
import matplotlib.pyplot as plt
import pandas
from shapely.geometry import Polygon
import geopandas

import pygridgen as pgg
import pygridtools as pgt


def show_the_grid(g, domain, river, islands, colors=None):
    fig, (ax1, ax2) = plt.subplots(figsize=(12, 7.5), ncols=2, sharex=True, sharey=True)

    _ = g.plot_cells(ax=ax1, cell_kws=dict(cmap='bone', colors=colors))
    _ = g.plot_cells(ax=ax2, cell_kws=dict(cmap='bone', colors=colors))

    pgt.viz.plot_domain(domain, ax=ax2)
    river.plot(ax=ax2, alpha=0.5, color='C0')
    islands.plot(ax=ax2, alpha=0.5, color='C2')


    _ = ax1.set_title('just the grid')
    _ = ax2.set_title('the grid + all the fixins')

    return fig


def make_fake_bathy(grid):
    j_cells, i_cells = grid.cell_shape
    y, x = np.mgrid[:j_cells, :i_cells]
    z = (y - (j_cells // 2))** 2 - x
    return z
Masking basics
Let’s consider a simple, orthogonal \(5\times5\) unit grid and a basic rectangle that we will use to mask some elements of the grid:
In [2]:
y, x = np.mgrid[:5, 1:6]
mg = pgt.ModelGrid(x, y)

mask = geopandas.GeoSeries(map(Polygon, [
    [(0.50, 3.25), (1.50, 3.25), (1.50, 2.75),
     (3.25, 2.75), (2.25, 0.75), (0.50, 0.75)],
    [(4.00, 2.50), (3.50, 1.50), (4.50, 1.50)]
]))

fig, ax = plt.subplots()
fig, cells = mg.plot_cells(ax=ax)
mask.plot(ax=ax, alpha=0.5)
Out[2]:
<matplotlib.axes._subplots.AxesSubplot at 0x7fa92828b748>

Applying the masks options
You have couple of options when applying a mask to a grid
min_nodes=3- This parameter configures how manx nodes of a cell must be inside a polygon to flag the whole cell as inside thet polygon.use_existing=True- When this isTruethe new mask determined from the passed polygons will be unioned (np.bitwise_or) with anx existing mask that may be present. When this isFalsethe old mask is completely overwritten with the new mask.
Masking inside vs outside a polygon
In [3]:
fig, (ax1, ax2) = plt.subplots(figsize=(6, 3), ncols=2, sharex=True, sharey=True)

common_opts = dict(use_existing=False)

# mask inside
_ = (
    mg.mask_centroids(inside=mask, **common_opts)
      .plot_cells(ax=ax1)
)
mask.plot(ax=ax1, alpha=0.5, color='C0')
ax1.set_title('Mask inside')

# mask outside
_ = (
    mg.mask_centroids(outside=mask, **common_opts)
      .plot_cells(ax=ax2)
)
mask.plot(ax=ax2, alpha=0.5, color='C2')
_ = ax2.set_title("Mask outside")

Masking with nodes instead of centroids
This time, we’ll mask with the nodes of the cells instead of the centroids. We’ll show four different masks, each generated with a different minimum number of nodes requires to classify a cell as inside the polygon.
In [4]:
fig, axes = plt.subplots(figsize=(13, 3), ncols=4, sharex=True, sharey=True)


common_opts = dict(use_existing=False)

for ax, min_nodes in zip(axes.flat, [4, 3, 2, 1]):
    # mask inside
    _ = (
        mg.mask_nodes(inside=mask, min_nodes=min_nodes, **common_opts)
          .plot_cells(ax=ax)
    )
    mask.plot(ax=ax, alpha=0.5)
    ax.set_title("min_nodes = {:d}".format(min_nodes))

Example with islands and rivers
In [5]:
domain = (
    geopandas.read_file("masking_data/input/GridBoundary.shp")
        .sort_values(by=['sort_order'])
)

river = geopandas.read_file("masking_data/input/River.shp")
islands = geopandas.read_file("masking_data/input/Islands.shp")


fig, ax = plt.subplots(figsize=(7.5, 7.5), subplot_kw={'aspect': 'equal'})
fig = pgt.viz.plot_domain(domain, betacol='beta', ax=ax)
river.plot(ax=ax, color='C0', alpha=0.5)
islands.plot(ax=ax, color='C2', alpha=0.5)
Out[5]:
<matplotlib.axes._subplots.AxesSubplot at 0x7fa8dc1c2780>

Creating a Gridgen objects
In [6]:
# number of nodes in each dimension
i_nodes = 100
j_nodes = 20

# grid focus
focus = pgg.Focus()

# tighten the grid in the channels around the big island
focus.add_focus(5. / j_nodes, 'y', 4., extent=8./j_nodes)
focus.add_focus(14.5 / j_nodes, 'y', 4., extent=4./j_nodes)

# coarsen the grid upstream
focus.add_focus(98. / i_nodes, 'x', 0.25, extent=4./i_nodes)

# tighten the grid around the big island's bend
focus.add_focus(52. / i_nodes, 'x', 4., extent=20./i_nodes)

# generate the main grid
grid = pgt.make_grid(
    domain=domain,
    ny=j_nodes,
    nx=i_nodes,
    ul_idx=17,
    focus=focus,
    rawgrid=False
)

Mask out everything beyond the river banks
In [8]:
masked_river = grid.mask_centroids(outside=river)
fig = show_the_grid(masked_river, domain, river, islands)

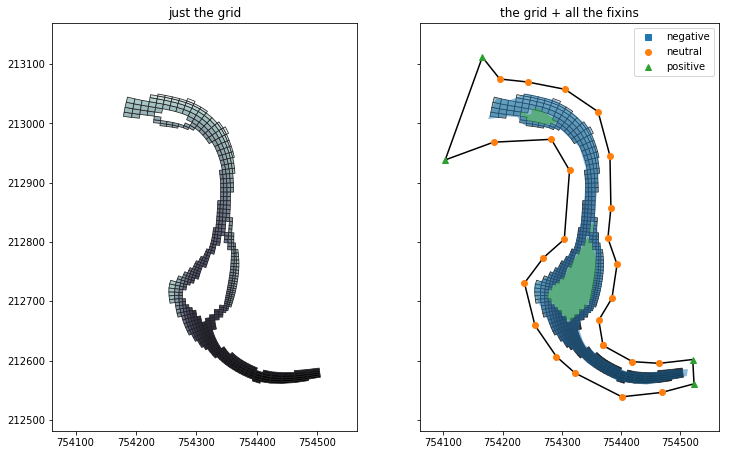
Loop through and mask out the islands
In [9]:
# inside the multiple islands
masked_river_islands = masked_river.mask_centroids(inside=islands)
fig = show_the_grid(masked_river_islands, domain, river, islands)

Plotting with e.g., bathymetry data
The key here is that you need an array that is the same shape as the centroids of your grid
In [10]:
fake_bathy = make_fake_bathy(masked_river_islands)
fig = show_the_grid(masked_river_islands,  domain, river, islands, colors=fake_bathy)
Exporting the masked cells to a GIS file
In [11]:
gdf = masked_river_islands.to_polygon_geodataframe(usemask=True)
gdf.to_file('masking_data/output/ModelCells.shp')
/home/docs/checkouts/readthedocs.org/user_builds/pygridtools/conda/latest/lib/python3.6/site-packages/geopandas/io/file.py:108: FionaDeprecationWarning: Use fiona.Env() instead.
  with fiona.drivers():